Kaggle Interactive Dashboard: San Francisco Restaurant violations
Posted on December 27, 2018
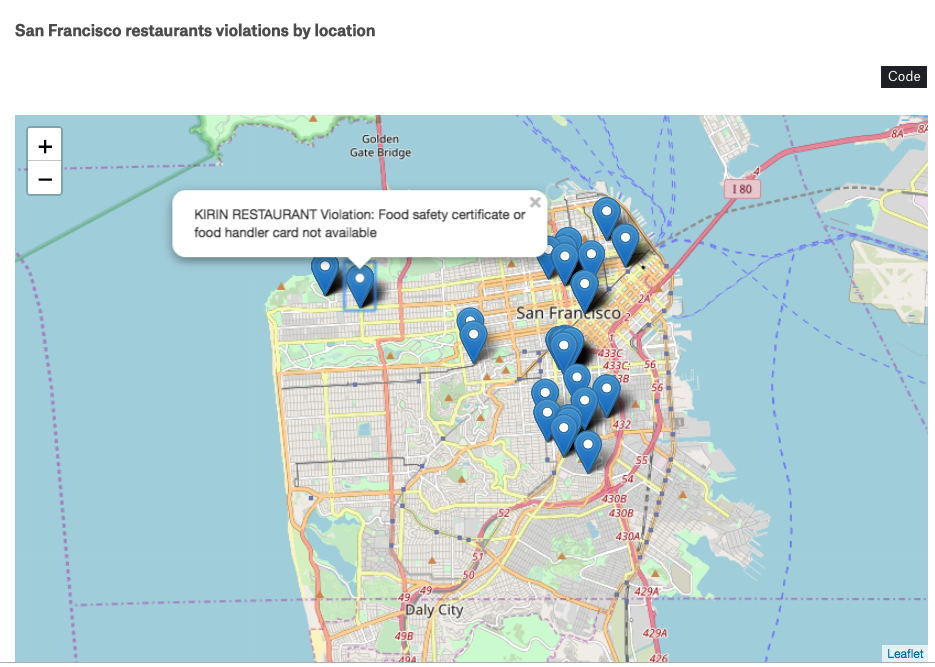
This dashboard displays the latest 100 inspections reported by the city of San Francisco, California in this data set. There is a a map with the location of the restaurants with violations, a chart for the inspection per day and pie chart for the violations risk categories. This work was done during the December 2018 Kaggle's Dashboard training. It is hosted online by PythonAnywhere free cloud service. The page is updated daily at 00:00:00 UTC time (4:00 PM PST). The interactive graphs were done with Plotly, while the interactive map was done with Folium.